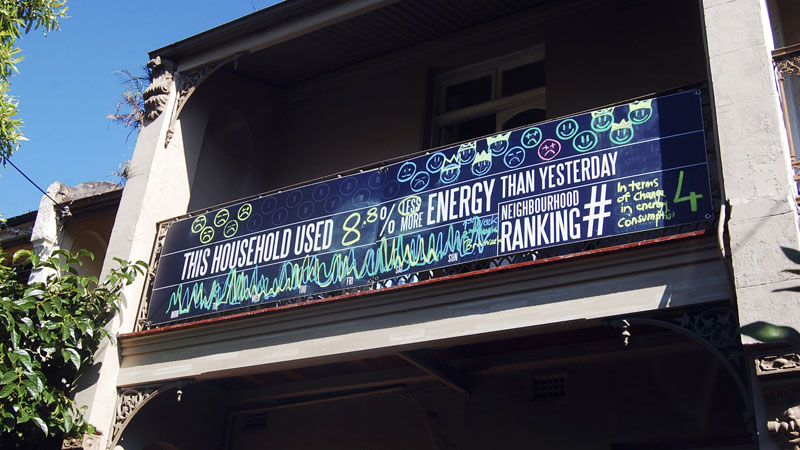
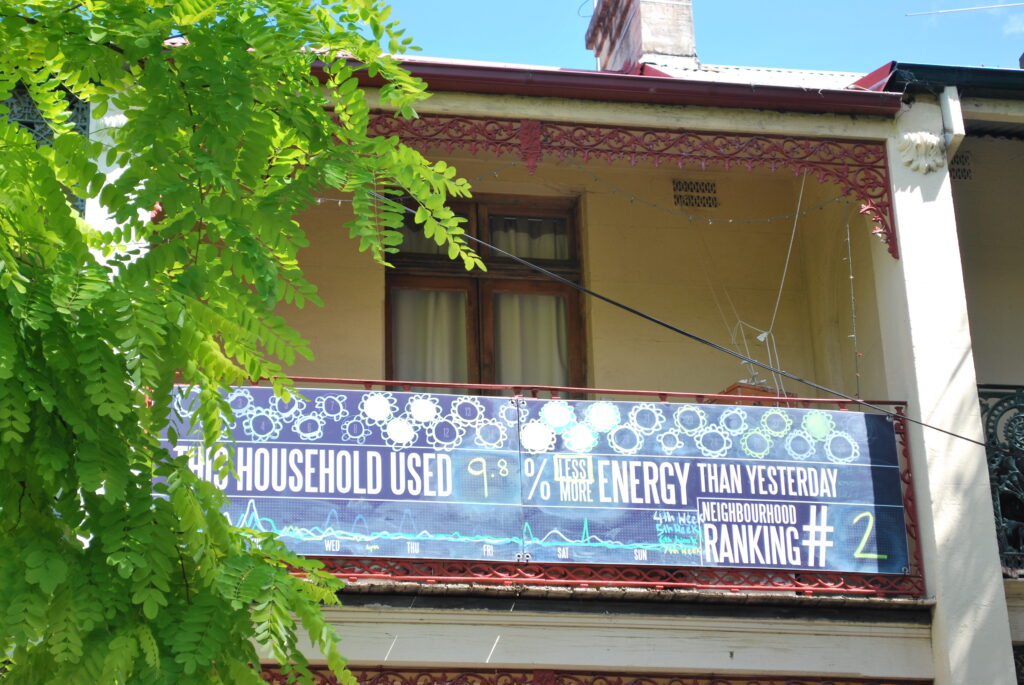
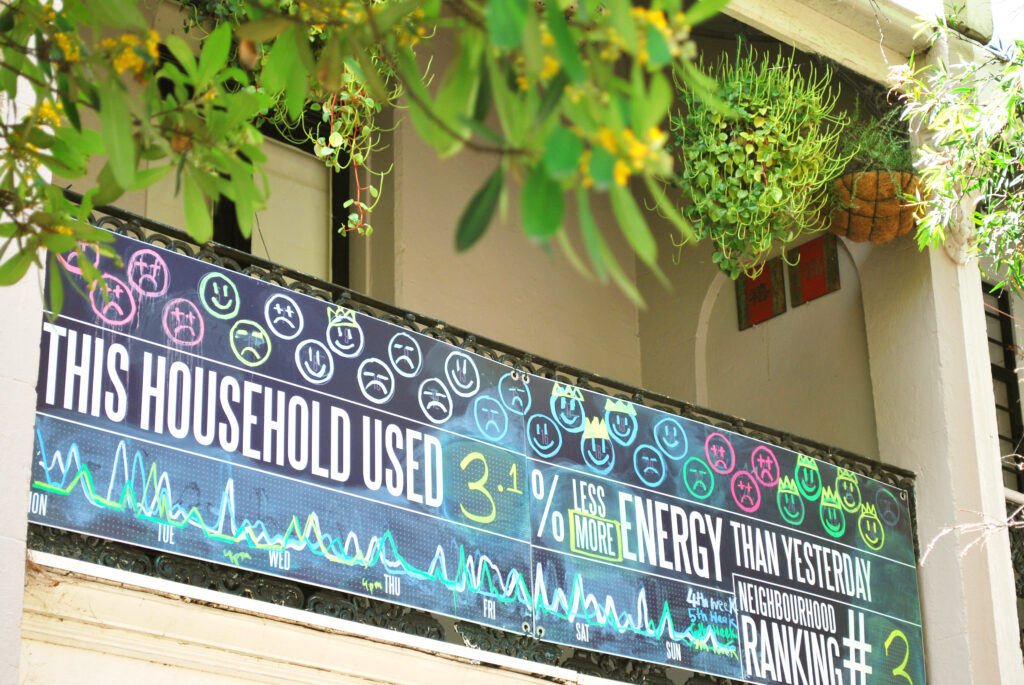
The project investigates the effect of public exposure of domestic energy usage on house facades. From October to November 2010 five chalkboards as feedback displays were installed in a Sydney neighbourhood and manually updated each day.
The visualisation included the change of electricity consumption compared to the previous day, a symbolic representation for each day of the current month, a graph representation for each week, and a daily neighbourhood ranking.
The energy performance of the five houses equipped with public displays was compared to two control groups: The first control group consisted of three households that received a common electricity monitor. The second group consisted of three households, for which we measured the electricity consumption during the study period, but without giving participants access to this information.
The quantitative measurements showed that households that received a public display decreased their energy usage on average by 2.5% per week compared to a decrease of 1.0% per week in the control group with a common electricity monitor and 0.5% per week in the control group with no feedback.
The presence of a public display further led to a more sustained conservation behaviour compared to only having access to private feedback. Interviews with participants confirmed the effect of the competitive neighbourhood ranking as being ideal for initiating behaviour change, but also revealed several unexpected side effects such as clustering energy-intensive activities to specific strategic times.
Project website: https://neighbourhoodscoreboards.com


People
- Andrew Vande Moere
- Martin Tomitsch
- Monika Hoinkis
- Elmar Trefz
- Silje Johansen
- Allison Jones
Publications
- Vande Moere, A., Tomitsch, M., Hoinkis, M., Trefz, E., Johansen, S., and Jones, A. (2011). Comparative Feedback in the Street: Exposing Residential Energy Consumption on House Facades. Proceedings of 13th IFIP TC13 Conference on Human-Computer Interaction (INTERACT 2011), Lecture Notes in Computer Science, vol 6946. Springer, Berlin, Heidelberg.
- Tomitsch, M. (2014). Towards the real-time city: An investigation of public displays for behaviour change and sustainable living. Proceedings of the 7th Making Cities Liveable Conference, PANDORA Archive, National Library of Australia.